Debug your Gradle files

I’ve written an article about how to debug an annotation processor a couple of weeks ago and it has been really helpful for me (at least) to just open it and just copy the commands necessary to start this process.
Although the process it’s similar, as I face other challenges, I felt that I needed to write one on how we can debug the build.gradle file.
How to debug build.gradle
First, let me start by describing my current setup — I’m using Android Studio 3.4.2 with Gradle version 5.4.1 and plugin 3.3.2.
Note: there might be some changes on older versions of Gradle/plugin, so if you encounter any problem feel free to ping me.
In order to debug you’ll need to:
- First, create a Remote Configuration so you can attach it later to debug your annotation processor code:
- Go to “Edit Configurations…” (Run/ Debug Configurations)
- Click on the plus sign (“+”)
- Select “Remote”
- You should have a new configuration added that’s similar to this one:
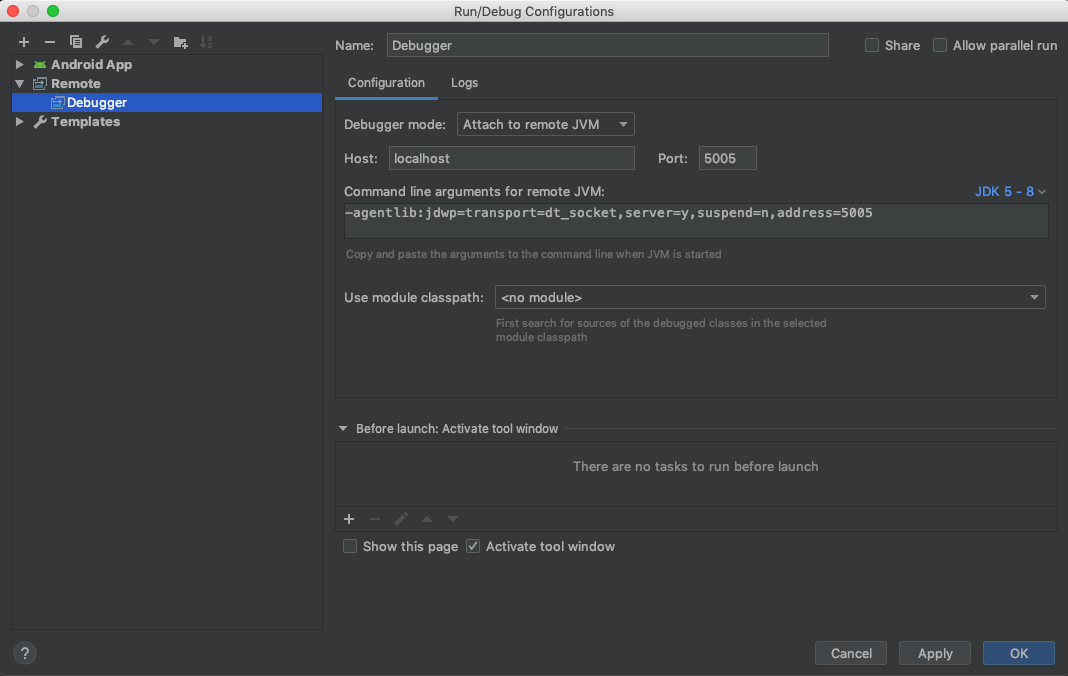
Remote debugger configuration I’ve used the default configuration here — I’ve just changed the default name to Debugger so it will be easier to spot on Android Studio actions bar.
- Now you’ll need to define the JVM arguments used when creating the daemon process. For this, you’ll need to update gradle.properties with the following arguments:
org.gradle.jvmargs=-Xmx4g -XX:MaxPermSize=512m -Dfile.encoding=UTF-8 -agentlib:jdwp=transport=dt_socket,server=y,suspend=n,address=5005The first arguments are JVM specific and can vary from project to project, the agentlib are the important ones in this case and correspond to:
transport
Name of the transport used to connect to the debugger application (required). The default value if not set isnone.address
The transport address for the connection. Ifserveroption is set tonthe debugger will attempt to be attached at this address; if instead is enabled -yit will listen for a connection at this port (ifserver=nthis option is required). The default value if not set is “” (empty).server
Ifyit will listen for a debugger to be attached; otherwise, will attach to the debugger application at the specified address (not required). The default value if not set isn.suspend
It defines the policy used onVMStartEventif y it will beSUSPEND_ALLotherwise will beSUSPEND_NONE(not required). The default value if not set isy.Note: there’s no need to set
org.gradle.daemontotruesince we already changed the JVM arguments. Doing it so is the equivalent of adding:-agentlib:jdwp=transport=dt_socket,server=y,suspend=y,address=5005I find it easier to debug by first attaching the debugger and only after triggering the Gradle daemon to run. Otherwise, you’ll need to wait for the process to start which can take a while and you might get distracted and end up waiting for a longer time than it is needed.
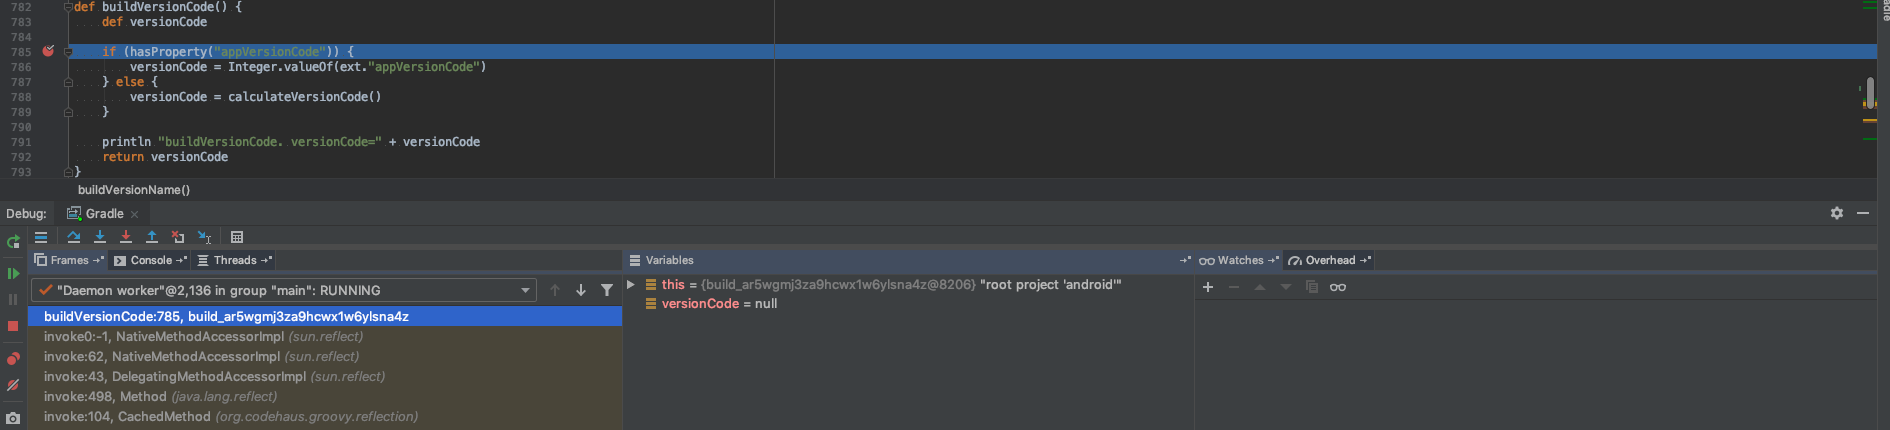
- Now that you’ve got everything ready go to your build.gradle file and add the breakpoints on the method/task that you want to debug.
- In order to trigger the breakpoints, you’ll need to first attach the debugger:

Remote config "Debugger" and then to start the Gradle daemon.
You can do this by either clicking on Sync Now, Refresh Gradle Project, or just by entering on Terminal:
./gradlew --daemon
For more information:
Do you have a better approach? Something didn’t quite work with you? Feel free to send me a message 🙂.