Debug annotation processor in Kotlin

I’ve recently revisited a library that I’ve done a while back using annotation processor and as soon as I opened it and started reading the code I’ve remembered how difficult it was to debug it at the time. So, a few years later let’s see what changed and how can we use the debugger instead of just adding some log messages.
Log messages
In order to print messages during compile time of your annotation processor you need to use ProcessingEnvironment.getMessager().printMessage(…) . The ProcessingEnvironment object is defined in the AbstractProcessor class and you can easily access it when you extend it.
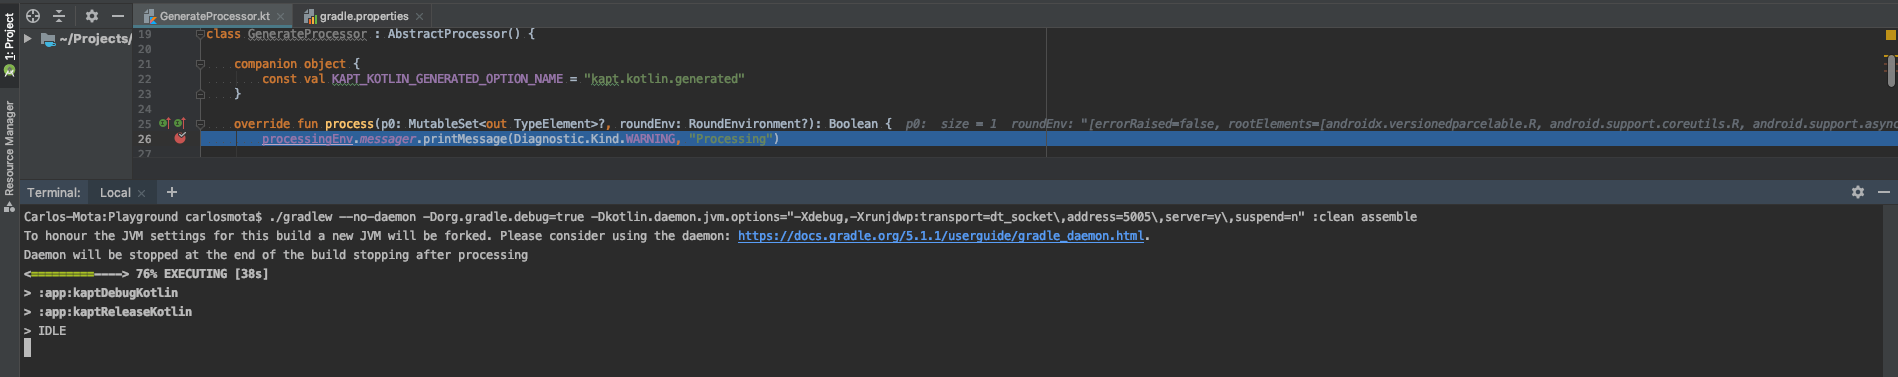
class GenerateProcessor : AbstractProcessor() {

  override fun process(type: MutableSet<out TypeElement>?,
                       roundEnv: RoundEnvironment?): Boolean {

  processingEnv.*messager*.printMessage(WARNING, "Processing")
  ...
Although this method can receive a couple of arguments, typically we send it just two:
void printMessage(Diagnostic.Kind kind, CharSequence charSequence);
Kind corresponds to the type of log message (sorted by severity, being the first one the most critical):
ERROR
When something is invalid or it’s missing. If this type is defined the compilation process is aborted and the error displayed on the console log.
WARNING
When something it’s not 100% correct but it’s not enough to stop the compilation process.
MANDATORY_WARNING
Similar to a warning, but is mandated by the tool’s specification.
NOTE
Informative message — for instance, when a task starts/ ends.
OTHER
When the message does not fit in any of the above categories.

Debug
Similar to attaching the debugger to an application that’s running on your smartphone or emulator you can do the same thing during the compilation process — which is truly incredible and really helpful, trust me.
How can you do this?
There are a couple of steps involved in this task — I’m currently using Kotlin v1.3.41 and Gradle 5.1.1 (with Android Plugin 3.4.2):
- We’re going to first create a Remote Configuration so you can attach it later to debug your annotation processor code:
- Go to Edit Configurations… (Run/ Debug Configurations)
- Click on the plus sign (“+”)
- Select Remote
- You should have a new configuration added that’s similar to this one:
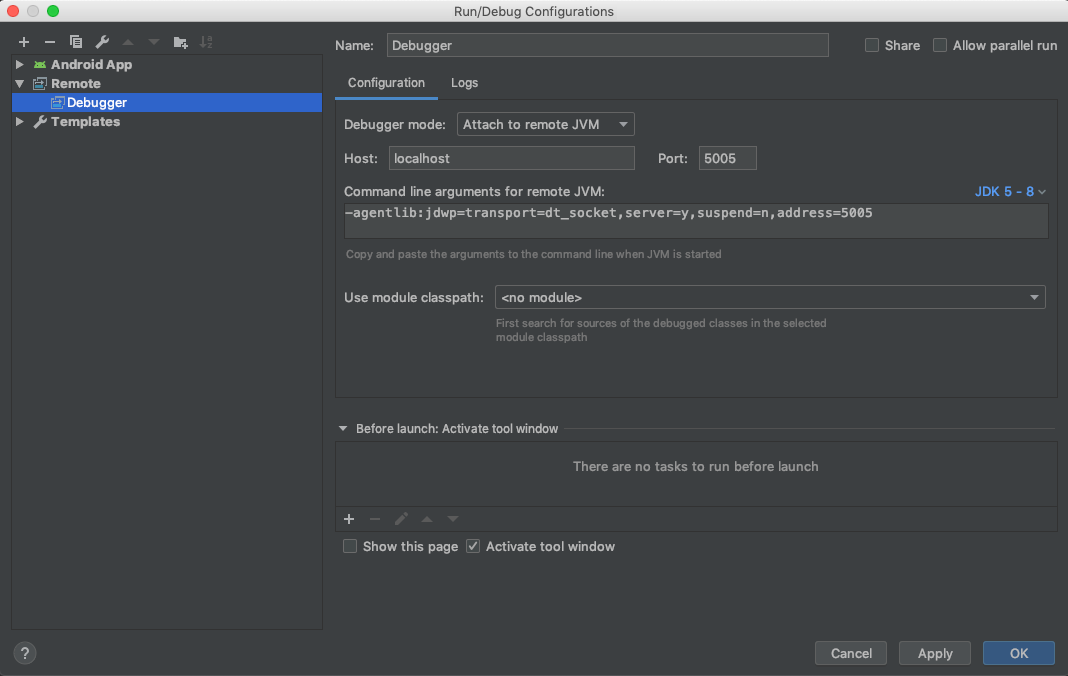
Remote debugger configuration I’ve used the default configuration here — I’ve just changed the default name to Debugger so it will be easier to spot on Android Studio actions bar.
- On your gradle.properties file you’ll need to add:
kapt.use.worker.api=trueotherwise, it won’t stop on your breakpoints.
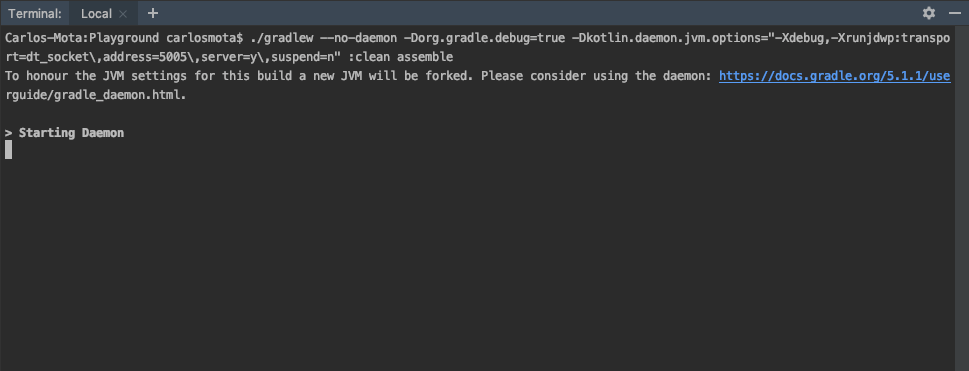
- Now that everything is prepared you can start compiling the app by entering the following command in Terminal (I typically use the one in Android Studio):
./gradlew --no-daemon -Dorg.gradle.debug=true -Dkotlin.daemon.jvm.options="-Xdebug,-Xrunjdwp:transport=dt_socket\,address=5005\,server=y\,suspend=n" :clean assembleBut what does this all mean?
Gradle daemon
-Dorg.gradle.debug=true
Starts a new Gradle process that will run the build with remote debugging enabled, listening on port 5005 by default. It’s equivalent to call:
-agentlib:jdwp=transport=dt_socket,server=y,suspend=y,address=5005
If you look at the suspend attribute you can see that it’s true, meaning that the virtual machine will be suspended until a debugger is attached.
Kotlin daemon
-Dkotlin.daemon.jvm.options="-Xdebug,-Xrunjdwp:transport=dt_socket\,address=5005\,server=y\,suspend=n"
Kotlin starts a daemon process that listens on port 5005 for a debugger
transport
Name of the transport used to connect to the debugger application (required). The default value if not set is none.
address
The transport address for the connection. If server option is set to n the debugger will attempt to be attached at this address; if instead is enabled - y it will listen for a connection at this port (if server=n this option is required). The default value if not set is “” (empty).
server
If y it will listen for a debugger to be attached; otherwise, will attach to the debugger application at the specified address (not required). The default value if not set is n.
suspend
It defines the policy used on VMStartEvent if y it will be SUSPEND_ALL otherwise will be SUSPEND_NONE (not required). The default value if not set is y.
And the last instructions are responsible to clean and compile the current project.
:clean assemble
After entering the command this process will wait until you attach the debugger — this guarantees that you don’t miss the breakpoint by not being fast enough:
Before, attaching the debugger don’t forget to check if you’ve got the right configuration selection. Once confirmed, just hit debug.

Once the daemon detects that the debugger is attached the compilation process continues until it detects your breakpoint.
Troubleshooting
I’ve spent some time trying to understand why this wasn’t working correctly in the first place — some useful commands that I’ve been using during this process were:
- jps — Java Virtual Machine Process Status Tool
$ jps
To list all JVM’s that are currently running. Before understanding the right commands to use I kept having Connection Refused errors when I tried to attach the debugger — this happened because I’d left a daemon active that was already bound to the port 5005.
$ jps
  5541 GradleDaemon
  294
  5671 Jps
You can easily stop it by either call ./gradlew —-stop or kill(pid) in this case, it would be kill(5541) .
For more information:
- Gradle docs: Build Environment, Gradle properties
- Oracle documentation: jrdocs
- Oracle documentation: jps
- Oracle documentation: Diagnostic.Kind
- Debug Annotation Processor Kapt on discuss.kotlinlang
Do you have a better approach? Something didn’t quite work with you? Feel free to send me a message 🙂.